
Product data after the sale: the blind spot


A direct-to-consumer brand knows its customers’ path to the second: which ad was clicked, how long someone spent on the product page, where the basket was abandoned, when the payment went through. After that it goes dark. Whether the product was unpacked, used, given away or put in a drawer, whether the instructions were understood, whether it was ever picked up a second time — none of that appears in any dashboard. This article describes what a digital touchpoint on the packaging makes visible at that point, which decisions it lets you take differently, and where the honest limits are.
- The data gap
- between completed purchase and a possible reorder
- Typical trigger
- a scan of a digital data carrier on the packaging
- Data type
- first-party data — no platform in between
- Possible without personal data
- time of scan, product variant, content usage, return visits
- Consent required
- for storage on the device and for analysis relating to a person
- Side condition
- the mandatory layer has to work without any consent at all
Where the data trail breaks off today
The gap is not carelessness but structural. Everything before checkout happens in systems that measure — ad platform, shop, payment provider. Everything after it happens in someone’s home. Between the shipping confirmation and a possible second order there is, in the vast majority of cases, not a single contact point that reports anything back. Newsletters and review requests only appear to fill the gap: they measure who responds to emails, not who uses the product.
In practice that means the most expensive metric in direct sales — whether a product served its purpose — is estimated from revenue proxies. Repeat-purchase rate, return rate and reviews are late, coarse and heavily skewed signals. They say something about the extremes, about delighted and annoyed customers, and almost nothing about the large middle that neither returns nor reviews.
What a scan touchpoint actually delivers
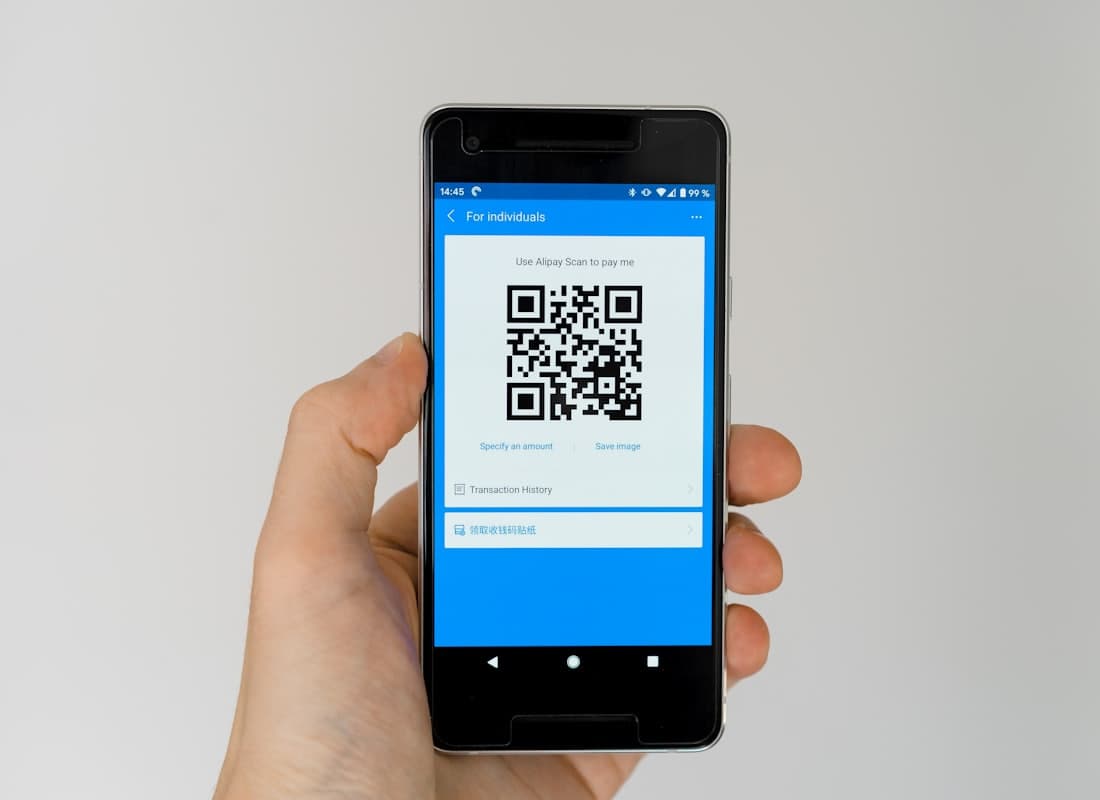
A digital data carrier on the packaging creates an event at the moment someone actively engages with the product. That is a qualitatively different signal from an ad click — it is unpaid, it comes from a product already bought, and it comes from the actual situation of use.
- Activation rate — what share of a batch gets scanned at all. The first hard figure on how many purchases turn into use.
- Time between dispatch and first scan — the span until unpacking, which differs by product and by channel.
- Repeat scans — the single most telling figure: a second or third scan shows use, not mere unpacking.
- Content used — is the digital manual opened, which step is called up repeatedly, where do people drop out.
- Product variant and batch — where the code resolves differently per variant or batch, complaints can be tied to a production batch.
- Regional distribution at a coarse level — which markets are actually in use, independently of where you shipped.
- Transition into a relationship — registration, reorder, newsletter, community, where offered.
Why this is first-party data
These events arise on your own address, triggered by your own product. No ad platform sits in between, and no browser or operating-system tracking restriction decides whether you get to see them. It is the most stable data type a direct-selling brand can build — and the only one that cannot disappear when a third party changes its rules.
From metrics to decisions
Data without a decision attached is a dashboard nobody opens. The figures only become interesting where they replace an assumption that is currently guesswork.
- Product development: if one step of the instructions is called up repeatedly above average, it is not clear. That is a concrete change request — before the next print run, not after the tenth support ticket.
- Packaging design: the activation rate measures directly whether the code can be found. Position, size and call to action can be compared between two print runs.
- Range: repeat scans show which product stays in use and which disappears after unpacking — considerably earlier than the repeat-purchase rate.
- Support: where usage drops off at a particular point, that is where a help page belongs. It reduces enquiries instead of answering them better.
- Channel assessment: if purchases from one channel turn into use less often than from another, the metric “cost per order” is incomplete.
- Complaint analysis: batch-level scans make visible whether a problem comes from production or from the product.
Data protection: what works without consent
The whole approach stands or falls on being built cleanly in data-protection terms — and that is more achievable than many assume, because the most interesting metrics need no link to a person. Activation rate, time distributions and content usage are aggregates. They can be collected without identifying anyone, as long as no profile is built over time.
- Analysable without personal data: number of scans, coarse distribution over time, which content was called up, drop-off points, product variant.
- Consent required (§ 25(1) TDDDG, Germany’s implementation of the ePrivacy rules): any storage of information on the device that is not strictly necessary for the service requested — in particular recognising a device across several visits.
- Consent required (Art. 6(1)(a) GDPR): analysis relating to a person, linking to a customer account, marketing outreach.
- Purpose limitation: if you justify the access with a mandatory disclosure, you may not quietly use it to build profiles.
The mistake that undoes everything
The mandatory layer must never sit behind a consent banner, a registration or an app. Showing a mandatory disclosure only after someone accepts marketing cookies turns a transparency duty into a barrier — and creates two problems instead of none. The mandatory disclosure first and freely accessible; everything else after it and voluntary.
The honest limits
Three constraints belong in any plan, because otherwise they turn up later as disappointment. First: the activation rate is low to begin with. A code with no visible reason is rarely scanned; what matters is what stands next to it — “instructions”, “check the origin”, “order a spare part” beat any bare code. Second: you see scanners, not users. Anyone who never scans stays invisible, and that group differs systematically from the other — every analysis carries that bias with it.
Third: a scan is not proof of satisfaction. It proves contact, not approval. Selling it as a quality metric repeats the mistake click-through rates made in online advertising. The value of this data lies in comparisons — between products, between print runs, between channels — not in absolute numbers.
How to start
- Pick a product that is going to reprint anyway. The timing of the next run sets the start, not the roadmap.
- Fix two metrics before anything is built. Usually that is the activation rate and the share of repeat scans.
- Give people a reason to scan. The digital manual is the most reliable one, because it solves an existing problem rather than making a new offer.
- Separate the mandatory layer from the experience layer from the outset — technically and editorially. Doing it afterwards is expensive.
- Set up addresses to last. A code on a packaging outlives any campaign landing page; the URL structure belongs in the architecture, not in marketing.
- After the first run, compare rather than judge. Only the second run turns a number into a statement.
Where the leverage really is
The cost of the access route is already paid — by the labelling duties that are coming anyway. What goes beyond it is the decision to put something behind the same code that is useful to people and measurable at the same time. That decision is not taken in a data project but when the next print file is signed off.
Note
The data-protection points are an assessment against objective criteria and not binding legal advice. For an assessment of your specific processing, please consult a lawyer or your data protection officer.
Talk to us
From a mandatory code to a channel of your own
We build the mandatory layer from your supplier evidence and put the experience layer on top — on an address that still resolves in eight years.
Discuss the approach